Metro ridership tends to fluctuate each year, but the numbers we hear usually don’t zoom in on how use varies from station to station. This interactive graph lets you view and compare how much use each station has seen since Metro’s inception.
To view multiple stations or lines simultaneously, just hold down your control button while clicking on the places you want to compare. Each station’s ridership, which is its average number of boardings per weekday, then shows up as a series on the graph.
There are plenty of fascinating trends to uncover here. For example, note how Pentagon ridership reached its highest level just before the resolution of the Cold War, or how Stadium-Armory exploded with riders during the Nationals’ brief stint at RFK.
What do you notice in these graphs?

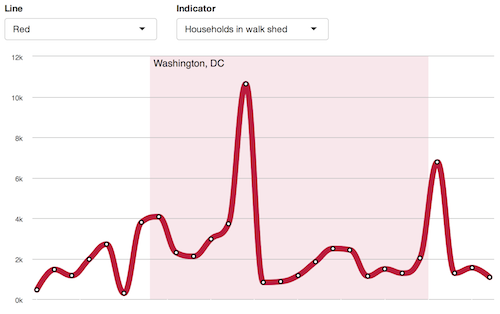
Transit succeeds when stations are within walking distance of living spaces and jobs. Using recently-released walk shed data from PlanItMetro, we developed an interactive visualization that shows which Metro lines and stations are most accessible by foot.
Each dot on the charts represents one Metro station, and you can view different variables using the “line” and “indicator” toggles at the top.
At first glance, these charts confirm conventional Metro wisdom: stations in DC’s dense northwest neighborhoods have the most households in walking distance, and downtown is a walkable job center.
But there are other interesting patterns to uncover here, too. For instance, we see that stations with multiple entrances tend to have larger walk sheds. It’s also clear that Tysons has a long way to go in its transformation.
What else do you notice in these graphs?
